Stellar Price Prediction for Today, March 21: XLM/USD Spikes Toward $0.100 Resistance
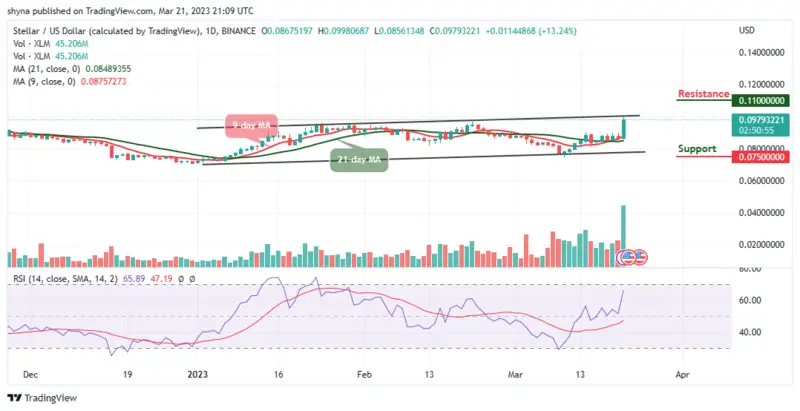
The Stellar price prediction is rising with a gain of 13.24% over the past 24 hours as the coin rises above the $0.95 level.
Stellar Prediction Statistics Data:
- Stellar price now – $0.097
- Stellar market cap – $2.5 billion
- Stellar circulating supply – 26.5 billion
- Stellar total supply – 50 billion
- Stellar Coinmarketcap ranking – #27
XLM/USD Market
Key Levels:
Resistance levels: $0.110, $0.120, $0.130
Support levels: $0.075, $0.065, $0.055

XLM/USD is trading above the resistance level of $0.95 as the coin heads to the upside. It could be possible that the more the support level of $0.085 is tested, the more it is likely to break higher. However, if the buyers fail to push the coin to the upside, traders could expect the market price to break beneath, and this may likely test the critical support levels of $0.075, $0.065, and $0.055.
Stellar Price Prediction: Can Stellar Head to the Upside?
The Stellar price is hovering around $0.097 with a bullish cross above the 9-day and 21-day moving averages. Therefore, if the bulls put more pressure, the Stellar price may cross above the upper boundary of the channel, which could hit the resistance levels at $0.110, $0.120, and $0.130.
Moreover, the technical indicator Relative Strength Index (14) is moving to cross into the overbought region as the signal line faces the north. In the meantime, more buyers may come into focus for a larger divergence if the upside is noticed.
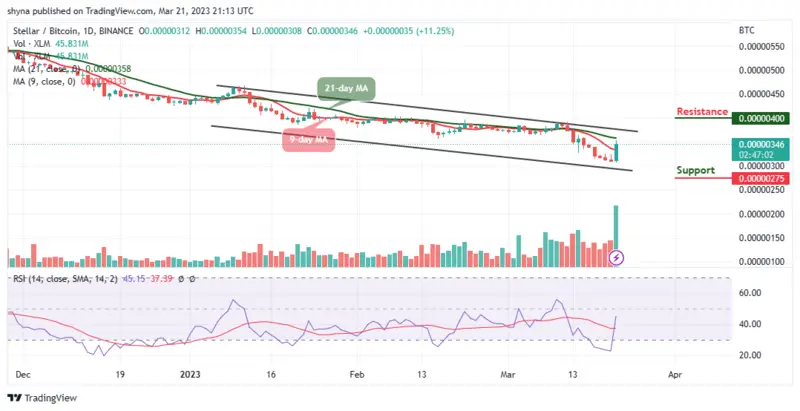
Against Bitcoin, the Stellar price crosses the 9-day moving average but remains below the 21-day moving average. However, after bottoming out around 308 SAT, the market price begins to ascend and it is currently trading around 346 SAT. However, the Stellar price is now contained within the channel as traders wait for the bulls to hopefully push the price above the moving averages.

On the upside, if the bulls can break above the 21-day MA, traders can expect initial resistance at 370 SAT. Above this, higher resistance could be located at 400 SAT and above. Alternatively, If the market faces the lower boundary of the channel, XLM/USD may hit critical support at 275 SAT and below. Meanwhile, the Relative Strength Index (14) is moving above the 40-level and it’s likely to follow a bullish movement.
Alternatives to Stellar
The Stellar price is currently holding the ground within the channel after a major recovery from the opening price of $0.086. This shows that buyers could have the upper hand in the price movement, and they could easily push the coin above the upper boundary of the channel. Meanwhile, according to the official whitepaper, Love Hate Inu ensures that users have the chance to voice their opinion and find a supportive community. However, approximately 10% of the tokens will be retained in order to fund exchange listings and provide rewards to the community as almost $2m has been achieved in the ongoing presale.
Comments
Post a Comment